Uma Shankar and Alexis Zubrow know all too well that what you breathe can be hazardous to your health. The two are research associates at the Institute for the Environment at UNC Chapel Hill who study atmospheric pollutants such as particulate matter and ozone and how technology tools can be used to help decision makers understand their properties and make informed decisions related to human health and environmental quality. With help from RENCI, they are now able to “see” microscopic pollutant particles (particulate matter, or PM) and examine how PM populations are distributed in size and how their physical characteristics change over time.
“We had a need to visualize atmospheric PM in specific ways,” said Shankar, who is the principal investigator on a NASA-funded project to use satellite and ground-based data to improve air quality decision support tools. “We turned to RENCI because it was beyond our capability to visualize some of its multi-dimensional aspects.”
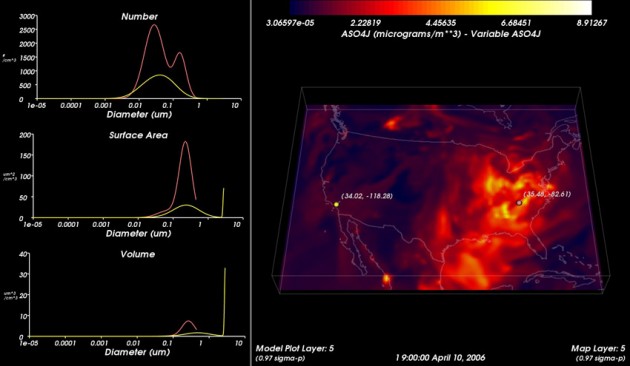
RENCI senior software developer Steve Chall and senior visualization researcher David Borland created a tool called Visualize Particulate Matter (VPM) to investigate the behavior of pollutants in a visual framework. VPM takes data from computer models of PM populations and presents it visually, so the researchers can see how PM properties—their number, surface area and volume concentration, for example—change over time. The VPM user can interactively track the pathways of PM plumes across geographic areas while examining how these particle properties change as they disperse outward from power plant stacks and other emission sources.

A still of the RENCI-developed Visualize Particulate Matter (VPM) software tool demonstrating the size distribution of pollutants in a visual framework.
Moreover, VPM allows model simulations of PM distributions to be overlaid with observed distributions from field instruments, enabling researchers to evaluate the accuracy of the models.
“It’s easy to visualize a single pollutant metric with our existing tools, but being able to visualize the complex chemistry, microphysics and atmospheric transport processes of PM as a composite animation, this is something that we haven’t been able to do ourselves and because we lacked the tools,” said Zubrow.
Development of the VPM application that runs on a Linux server is nearly complete and the research team is developing a web application that will integrate VPM into a larger Web-based system called Visibility Information Exchange Web System (VIEWS). VIEWS includes a variety of tools and data aimed at improving air quality decision-making. Researchers and decision makers in government agencies and planning organizations use VIEWS to help assess and implement emission standards designed to protect human health.
Shankar expects VPM to be beta tested by VIEWS end users at the U.S. Environmental Protection Agency, the National Park Service, and other agencies over the next few months. Agency personnel regularly discuss what metrics need to be considered when determining fine particle emission standards to safeguard public health and VPM will allow them for the first time to see animated visualizations of some of these metrics.
“There is still much discussion about which PM properties are responsible for adverse health effects,” said Shankar. “VPM will provide a more effective tool to understand those health impacts and develop policy.”
*This project is funded by the National Aeronautics and Space Administration grant number NNX08AL28G


