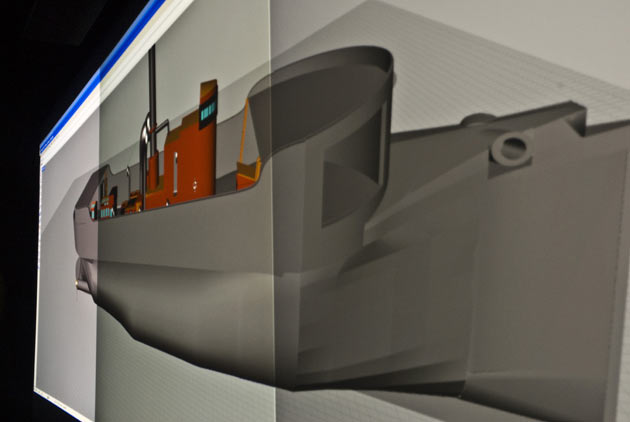
John Wagner won the RENCI at ECU Visualization Challenge with this representation of a 19th century gunboat.
RENCI at East Carolina University’s (ECU) second annual Visualization Challenge, held March 25, featured presentations on the center’s 21-foot by 6-foot visualization wall on topics ranging from 3D archeological ship reconstruction to research into genetic diseases using fruit flies.
Each presentation was the culmination of hours of hard work and dedication, so all participants received a stipend for their contributions. Of the seven presentations, John Wagner’s 3D reconstruction of a 19th century gunboat won first place and was recognized during Research and Creative Achievement Week, March 30 – April 3. Wagner is a graduate student in maritime history. All seven Visualization Challenge participants were students.
Wagner’s winning entry, Reconstruction of the HMS Medway/Medina, accurately modeled in 3D a 19th century shipwreck near Bermuda. Much of the wreck has corroded or been mined for scrap, leaving only a shell of the original vessel. Wagner’s model accurately replicates the wreck and also incorporates, one layer at a time, structures and elements of the ship that have been lost over time, such as its cabins, guns, and sails. The visualization shows the ship as it slowly transforms from a wreck to a fully equipped vessel, as it might have looked in its glory days.
Other entries in the Visualization Challenge were:
• Reconstructing a 3rd Century B.C. Merchant Ship, by Peter Campbell, graduate student, maritime history. Using archeological records and Rhinoceros 3D modeling software, Campbell built a virtual recreation of an ancient merchant ship and its cargo. The computer software can also model the ship’s behavior on water, revealing how the oddly shaped boat would have sailed thousands of years ago.
• Changes in NDVI and EVI within a Small Caribbean Nation, by Teddy Allen, graduate student, geography. Allen presented a visualization of monthly and annual changes in vegetation in Jamaica. Small vegetation maps of the island nation were aligned to a grid, with each row containing maps for a given year and each column maps for a given month. The size of the visualization wall allowed all of the information to be viewed simultaneously for easy comparison and recognition of trends.
• Virtual Analysis of Building Systems Engaged During the Construction Process, by Charlotte Dietrich and David Truesdale, undergraduate students, construction management. Buildings are more complex than most people realize. Dietrich and Truesdale demonstrated this with their layered 3D models of a recently completed hospital complex. Everything from the roof trusses to the concrete rebar in the foundation was modeled to scale using the building’s original blueprints. In addition to its visualization applications, this project can help to accurately estimate construction material needs for building projects.
• Images from Drosophila Melanogaster, by Catherine Gouge, graduate student, biology. Gouge studies the cellular biology of drosophila—fruit flies. With the visualization wall she can view in 3D high-resolution images of microscopic tissue matter and examine genetic deformities occurring in the flies. By understanding these deformities, Gouge hopes to learn more about human disorders such as Alzheimer’s and heart disease.
• 3D Modeling of the Ocracoke Lighthouse, by Carrie Tragert, graduate student, geography; and Nick Lee, undergraduate student, geography. RENCI at ECU assistants Tragert and Lee work on models for visualizing hurricane storm surge on North Carolina’s Outer Banks. By modeling recognizable local landmarks, such as the Ocracoke Lighthouse, and using SLOSH (Sea, Lake and Overland Surges from Hurricanes) models to simulate the impact of storm surge flooding on the landmarks, they hope to educate and warn the public about the risks of storm surges.
• Visualizing Wind Farms along the Outer Banks, by Laurynas Gedminas, graduate student, geography. Inspired by proposed wind farm projects in Cape Cod, Gedminas used photographs and 3D modeling to measure the visual impact a similar project would have on the Outer Banks. The first part of his presentation used digitally modified photographs of the coast showing potential wind farms at 1 and 4 miles from the shore. The second part involved a Google Earth flyby tour of a potential wind farm location, complete with rotating 3D turbines.


