
RENCI and Duke researchers aim to understand whether VEs can help patients control diabetes
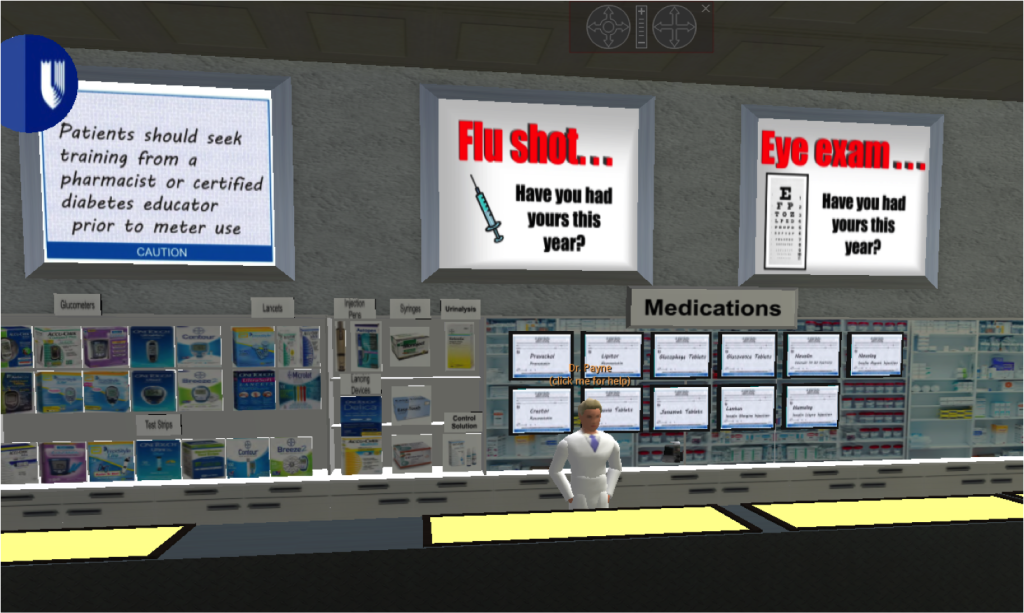
The pharmacy in the virtual environment created by Duke School of Nursing Researchers. The pharmacy allowed study participants to look up health information and information about medications.
Rates of type 2 diabetes are increasing, and the debilitating disease touches the lives of more and more people each day. Although genetic factors do play a role in the chance of an individual developing this chronic condition, lifestyle choices such as diet and exercise, also play crucial roles in both the risk of contracting type 2 diabetes, and managing and controlling it throughout an individual’s life.
Because personal choices and decisions matter so much in controlling type 2 diabetes, researchers want to know what motivates these choices and what influences personal decisions so they can develop better methods for controlling the disease.
Two faculty members in the Duke University School of Nursing study the interactions of type 2 diabetics in a unique way: a virtual environment (VE) where each patient uses an avatar to visit different locations and interact with others. To better understand what goes on in this virtual environment and how it might help patients combat this debilitating and sometimes fatal disease, they enlisted RENCI’s expertise.
RENCI first became involved in the project when Associate Professor Constance M. Johnson, PhD, and Assistant Professor Allison Vorderstrasse, DNSc, submitted a proposal to RENCI’s Faculty Engagement Program in Applied Scientific and Information Visualization, a program that supports visualization projects with researchers through the Duke and North Carolina State University RENCI engagement centers. The two professors had developed their virtual environment using the open-source platform Second Life, intending to study how it might be used to help patients with type 2 diabetes understand and control their disease. The virtual world included a gym, grocery store, library, and other locations where patients could access information pertaining to the control of diabetes.
They began their study in April 2010 with 20 volunteer participants, each of whom created an avatar in the VE. These individuals could participate in the VE as much, or as little, as they liked during their visits by interacting with other patients, forming social connections, and exploring the diabetes educational resources. Johnson and Vorderstrasse gathered data on the patients’ interactions, participation, and change (if any) in real-life health status as they used the virtual world. However, they then needed a way to visualize their data.
Turning data into results
“We first sought out RENCI’s help when we realized how much information we had,” said Vorderstrasse. “We wanted to show how much our subjects were visiting the world, where they were going and what they were doing there. We needed to turn our data into results.”
Once the team received the RENCI funding, RENCI Senior Research Software Developer Steve Chall and Duke Computer Science undergraduate Ang Li collaborated with them to create visualizations that track audio and text conversations as well as the movement of the avatars. By visualizing this data, the researchers hoped to understand the social structures and other behaviors that developed and their impact on participants’ abilities to manage their disease.
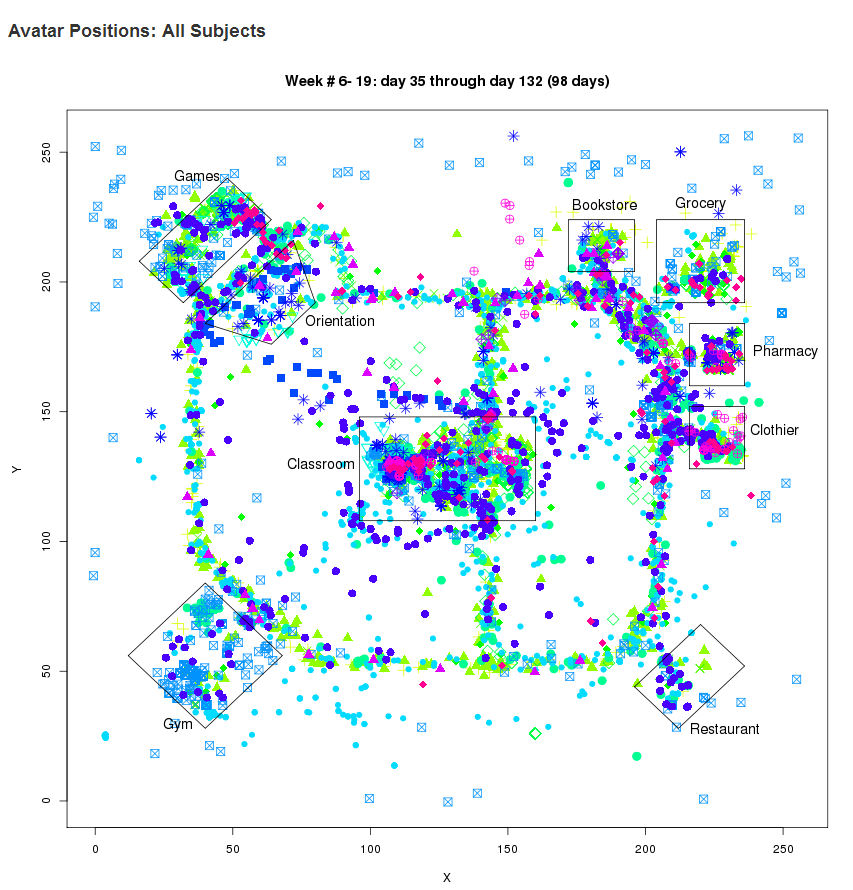
A visualization created by Duke undergraduate Ang Li using data collected from the initial study. It shows the frequency of where the participants’ avatars were located in the VE. This visualization helps the researchers assess the relative popularity and usefulness of the different locations within the VE.
According to Johnson and Vorderstrasse, their preliminary results show that the VE has the potential to help patients manage their diabetes, but due to the short time span and small sample size, the results are preliminary. The researchers wanted a more in-depth look at the data to better understand the potential of the virtual world. To this end they applied for, and recently received, a grant from the National Institutes of Health (NIH) to implement a much larger study, involving 300 patients over five years.
“We need to study a lot more people in this type of environment to see if the technology really can help,” said Vorderstrasse. “We are going to have about 10 times the amount of participants, so the data are going to increase immensely.”
As a participant in the NIH-funded project, RENCI will stay involved with the team, helping to visualize the influx of new data. Although the study is not scheduled to begin until the summer 2014, Chall and Li are currently hard at work visualizing the existing data and designing methods for handling the new data once it starts rolling in.
“Visualizing our data is essential to understanding how our study participants used the virtual world and how it affected them, and it will help us figure out the best ways to model the data,” said Johnson.
“This is potentially the most practical application of online 3D virtual environments that I’ve encountered,” said Chall. “Any inroads it may provide in helping to control the deadly epidemic of type 2 diabetes deserves a considerable investment in money and effort. Another appeal of this study is that it generates a wide variety of different and unusual kinds of data. Understanding these data and their relationships require novel approaches to visualization and analysis.” -Holly Beilin, Public Information Student Assistant