 David Borland, PhD, a RENCI senior visualization researcher, and Jeffrey L. Tilson, PhD, a RENCI senior research scientist, today announced the general release of Voluminous, a tool that scientists can use to visualize volumetric data sets.
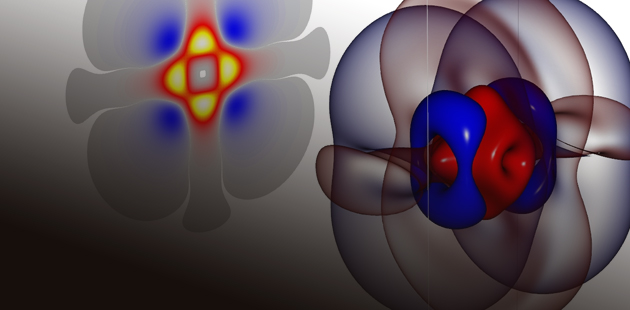
Voluminous is a tool developed to assist in visualizing volumetric scalar fields—three dimensional fields that associate a scalar value to every point in the field. Voluminous has been used to help chemists view the nodes in a field that separate its positively and negatively charged regions. It was originally developed to visualize computational chemistry electron density fields, where the input volume represents the difference between two scalar fields.
However, other scientific research that require the interpretation of the difference between fields can also benefit from using these visualization techniques, such as meteorological research that visualizes scalar fields for temperature, humidity, pressure and other variables.
“We think that Voluminous can be an effective tool for understanding the properties of a wide range of volumetric data sets in physics, chemistry, computational fluid dynamics, and other fields where researchers need to discover and interpret information about different scalar fields,” said Tilson. “We hope to engage a community of users and enable them be more productive.”
Long term, the RENCI team plans to release Voluminous as an open source tool. More information, examples, and instructions for downloading Voluminous is available in the visualization section of the RENCI website.


