Overview
Fine particles—such as pollen, dust, ash and pollutants—are constantly whirling through the air we breathe. But which particles are harmful, and in what concentrations? Government agencies responsible for safeguarding the health of humans and the environment must set emission standards and other regulations based on what they know about the properties of fine particles and how these particles disperse through the air.

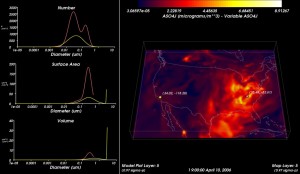
A still of the RENCI developed Visualize Particulate Matter (VPM) software tool in action demonstrating the behavior of pollutants in a visual framework
Although our understanding of particulate matter has greatly increased over the past decades, models that more accurately reflect the complex behavior of fine particles would help us better predict whether emissions from a particular source or event are likely to accumulate to harmful levels. With funding from NASA, researchers at the UNC Institute for the Environment are using satellite and ground-based data to improve models of particulate matter dispersion and to inform air quality regulation decisions.
RENCI teamed with scientists from the Institute for the Environment to deploy a visual framework for analyzing particulate matter models and data. The framework enables researchers to visualize the complex chemistry, microphysics and atmospheric transport processes of particulate matter as a composite animation—a significant improvement over previous tools that only allowed researchers to analyze one pollutant at a time.
Modeling the behavior of populations of fine particles requires highly complex computations. For example, models must account for airflow complicated by urban geography: Narrow streets lined with skyscrapers and other buildings prevent air currents from moving uniformly across the cityscape and cause updrafts and downdrafts. RENCI’s visualization tool allows users to interactively track the pathways of plumes of particulate matter across geographic areas while examining how their properties change as they disperse outward from power plant stacks and other emission sources.
Researchers import data from computer models into the visualization tool to “see” how the properties of multidimensional pollutant particles—their number, surface area and concentration, for example—change over time. In addition, the tool allows users to overlay actual data from field instruments over model visualizations, enabling researchers to evaluate the accuracy of their models.
Project Team
David Borland
Partners
Institute for the Environment at UNC Chapel Hill
Links
Keep Your Eye on the Particle: Visualization to Enhance Pollution Research
A Particle of Difference
Manhattan Wind Visualization

