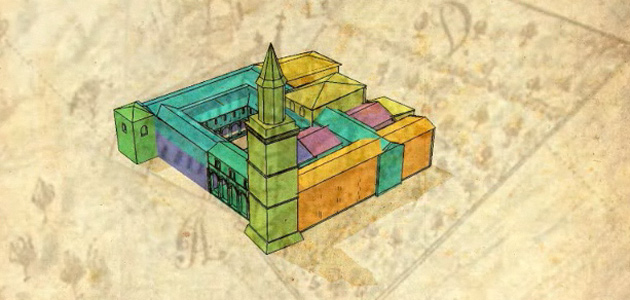
Visualization of the construction of Francesco a Folloni, Campania, Italy. What began as a class project will expand through the RENCI@Duke Applied Scientific and Information Visualization program.
DURHAM, NC–RENCI experts in visualization, visual analytics, and data mining and management will work with three Duke University research teams—one in the School of Medicine and two in art, art history, and visual studies—on projects to improve treatments for prostate cancer and to document the evolution of historic places, artwork, and art markets.
The projects are the first to be launched through the RENCI@Duke Faculty Engagement Program in Applied Scientific and Information Visualization, an effort to expand the use of visualization tools and technologies among Duke researchers. The research teams will receive about $12,000 each from RENCI to support their work and will be expected to develop new research methods, models, applications or prototypes that can lead to larger projects supported by grant money.
The projects are:
- A Visualization Tool for Knowledge-Based Treatment Planning for Prostate Cancer.
Joseph Lo, radiology
Shiva Das, radiation oncology
Vorakarn Chanyavanich, medical physics
Lo, Das and Chanyavanich will work with RENCI to develop a software tool that would allow clinicians to visualize and analyze a large dataset of prostate cancer cases in order to develop better treatment plans for patients. The research team will first develop a user interface for visualizing complex data, including 3D CT scans, 2D images, hand-drawn slice contours, volume rendered structure maps, and radiation fluence maps.
The visualization tool will draw on data from 500 prostate cancer cases at three institutions. CT scan data from new cases will be matched to similar information in the database and best matches will be used to develop treatment parameters. Those parameters will then guide the development of clinical-quality treatment plans.
RENCI will provide visualization resources, including its 13.5-foot-by-5-foot multi-touch visualization wall, and programming expertise to develop the user interface for the tool. RENCI experts also will render large, 3D volumetric datasets and offer advice on visualization, data mining and how to share data among institutions.
- Visualizing Historical Materials
Caroline Bruzelius, art, art history and visual studies (AAHVS)
Rachael Brady, Pratt School of Engineering and AAHVS
Sheila Dillon, Mark Olson and Raquel Salvatella de Prada, AAHVS
John Taormina, AAHVS and director, Visual Media Center
This project grew out of a class offered by the research team in 2009 in which students used digital visualization and mapping technologies to reconstruct works of art and historic places in 3D environments. The researchers will focus on three long-term projects:
- Creating a 3D relational database of ancient and medieval sculptures that links to the environments where the objects were originally displayed. The Nasher Museum at Duke and the Museum of Fine Arts in Boston are collaborators on the project.
- Reconstructing the history and development of Venice, Italy, through the development over time of its markets, bridges, administrative centers, and religions complexes. The project will start with a visual presentation of property acquisitions and development of the Dominican convent of Santi Giovanni e Paolo. The project is a collaboration with the University of Venice and the University of California at Merced.
- Continuation of a project with the Franciscan Order and convents of San Francesco a Folloni to visualize the construction and development of the Franciscan Churches of Campania in Florence, Italy. One of the researchers’ first goals will be to produce a laser scan of the interior of the Bascilia di San Lorenzo in order to precisely measure and analyze the building’s phases of construction.
RENCI’s role will include designing and implementing a database for 3D objects and their contexts, building a shared repository of assets (scanned documents, images, 3D models, maps), developing systems for data management and archival gallery publishing.
- Visualizing Art, Law and Markets
Victoria Szabo: art, art history, and visual studies (AAHVS) and program director, Information Science + Information Studies (ISIS)
Hillary Coe Smith, Sandra van Ginhoven, Katherine De Vos Devine, AAVS
Launched last year, this project, which applies information visualization techniques to the study of emerging art markets, will be integrated into the information visualization program. The project involves a team from the Duke Visual Studies Initiative (VSI) and seeks to create a collaborative infrastructure for analyzing market flows in early modern Europe using a variety of media incorporated into a database-driven, dynamic visualization tool. The tool will visualize influence networks and geographic market maps in order to understand how art markets emerged and grew. The research team plans to develop the tool so it will be useful to other VSI scholars.
About RENCI@Duke
RENCI@Duke opened in May 2008 and supports the use of visualization technology and advanced computational methods to explore issues in science, engineering, the arts, humanities and social sciences. Centrally located in the TelCom Building on Duke’s West Campus, the facility features a high-resolution multi-touch visualization wall, high-definition videoconferencing and networking capabilities, and staff specialists in visualization and informatics.


