Overview
Visualizations of geographically-referenced data, such as measures of disease occurrence across the country or atmospheric data around the globe, can be immensely useful. But developing applications using such data sets can be challenging. There is no standard format or cataloging system for geo-referenced data, and once the data sets are found and formatted, they must then be merged with an appropriate mapping system for visualization.
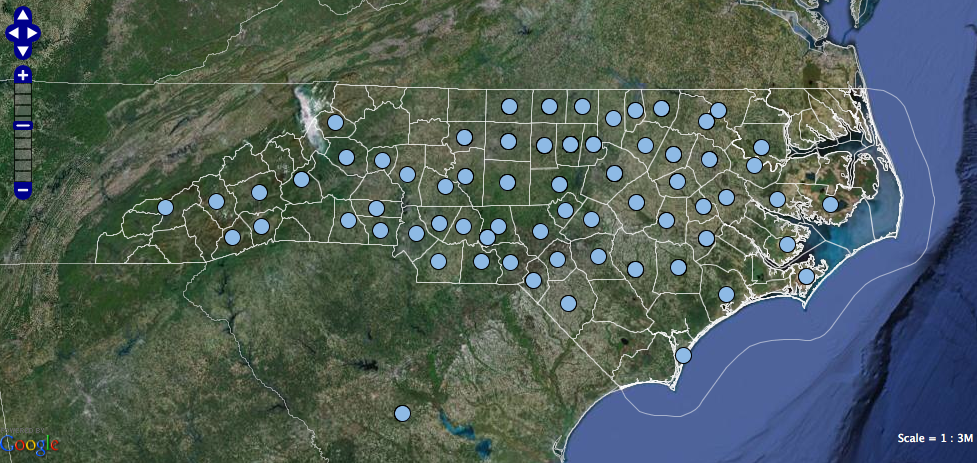
RENCI’s Geoanalytics Platform was cyberinfrastructure that provided a standard system to work with geo-referenced data in an intuitive, map-based format. Developed by Jeff Heard, a RENCI senior research software developer, the platform integrated data tied to specific locations with a Web-based mapping system (such as Google Maps). This enabled researchers to view their data as a Web-based visualization, with data points linked to locations on a map designated by zip codes, latitude and longitude, or street addresses. The visual infrastructure can be extended and customized to suit the needs of any geographic visualization project.
One geoanalytics platform that RENCI created was the Big Board, a real-time collaborative virtual environment that allows groups to interact with large images and maps. Users could create a virtual conference room on top of a map and annotate it in real time. All changes are broadcast to all users in the same virtual conference room.
This is a completed project and the software this software is no longer supported by RENCI.
RENCI Project Team
- Jeff Heard (Project Lead)
- Joe Hope