Overview
Public health organizations focus on improving health through prevention, management and treatment of diseases. For this reason, health agencies and researchers collect population health data from the census block level to the county level. Such data is analyzed to compute vital statistics that help public health officials understand the trends related to diseases within a given population. These analysis results also facilitate the decision making process for effective health policies and programs.
RENCI researchers identify easy and low-cost approaches to analyzing publicly available, county-level health related, vital statistics. This approach involves the use of Web 2.0 tools and freely available applications to aggregate, parse, format and perform ad-hoc queries, and to visualize North Carolina county-level datasets. The resulting visual interfaces are interactive and offer users the power to check trends in county data over time, compare health concerns in different counties, identify outliers and filter data. These Web 2.0 tools and dynamic features can be directly integrated into existing websites without building a complex database backend or using server-side technologies. The approach is less costly than more complex IT approaches, but still offers substantial capabilities.
Funding
State of North Carolina
Project Team
- Charles Schmitt, project leader
- Ketan Mane
Gallery of Public Health 2.0 Tools
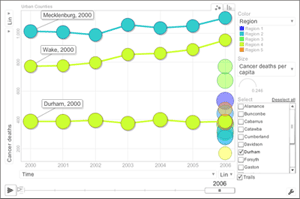
- Motion Charts: An interactive visualization for cancer deaths in North Carolina using the motion chart feature of Google Docs.
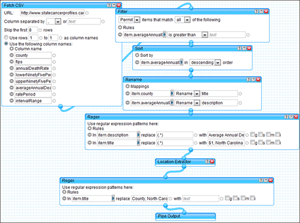
- Yahoo Pipes: A web-based data tool aggregating information on cancer in North Carolina from different data formats and processing them for viewing and exporting. (KML file )
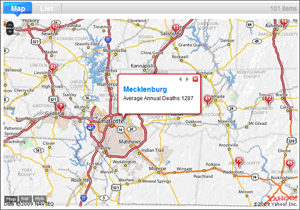
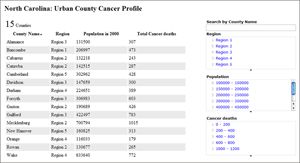
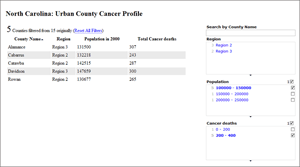
- Exhibit: A data filtering interface for cancer rates in North Carolina based on Exhibit, an open source lightweight structured data publishing approach developed at MIT.
